DFM: CONCURRENT COSTING
 DFA: PRODUCT SIMPLIFICATION


A Metric for Product Improvement
Motorola Solutions uses DFA software to benchmark designs and measure improvement in its global product portfolio
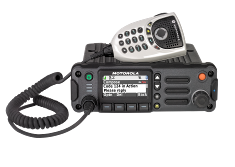
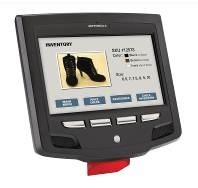
Every product in Motorola Solutions’ extensive portfolio—which includes handheld RFID readers (top), mobile radios (middle), multimedia micro kiosks (bottom), and many others—is benchmarked and analyzed during design/redesign using Boothroyd Dewhurst’s Design for Assembly (DFA) software to cut part count and assembly time.
How good are our product designs? Are they better than past versions? How do they compare with those from other companies?
With competition in the global economy fierce, management at telecommunications giant Motorola Solutions wanted to know the answer to these questions. It was up to Rich Darrell, engineering manager at the company’s Holtsville, NY design center, to provide the answers. Says Darrell, “Senior leadership challenged us to come up with a methodology for measuring whether our designs were improving.”
For Darrell and his team, that would mean getting a handle on a product portfolio that was hundreds of items deep: It encompassed government and public-safety devices from the parent Motorola plus mobile-data-capture and handheld-computing units added after a 2007 merger with Symbol Technologies. To further complicate the task, the various product lines were distributed among separate design and manufacturing teams at six centers around the world—three in the U.S, and one each in Israel, Mexico, and Malaysia.
Choosing how to measure
In response to the challenge, Darrell turned to Design for Assembly (DFA) software, a tool developed by Rhode-Island based Boothroyd Dewhurst, Inc. and first adopted by Motorola more than 25 years previously. Part of a broader software strategy called Design for Manufacture and Assembly (DFMA™), DFA is used to simplify product designs by eliminating any unnecessary parts, making assembly easier and lowering labor costs. The other module, Design for Manufacture (DFM), provides concurrent-costing estimates for alternative material and fabrication choices.
Following its introduction, DFA had become a driving engineering principle at the company and was integrated alongside lean and six sigma initiatives in their internal training program Motorola University (now called Motorola Solutions Learning). Over time, though, as the global enterprise grew more complex and the product portfolio expanded, engineering procedures evolved to keep pace—but not always in sync. “While every design center was using the software, each site had a different way of applying it to development,” says Darrell. “So in 2012, we formed a global DFA team and worked to come up with a unified process.”
Darrell along with colleague Chris Foley, a process engineer for new product development also based in Holtsville, led the initiative. Together, they honed in on a calculation from the software—the DFA index—as a key measure of overall product design. In simple terms, the index is a number arrived at by dividing an “ideal” assembly time by the actual assembly time, where an “ideal” assembly is defined as one having a theoretical minimum number of parts (for a more detailed explanation see Sidebar “Demystifying DFA”).
“DFA clearly shows what parts are required by product function and what parts can be eliminated,” says Foley. “As the software steps through the process, it illustrates how you can achieve significant cost avoidance by identifying opportunities for simplification of product structure.”
The two experienced engineers felt strongly that the DFA index would work well as a metric to quantify product improvement. “It was perfectly suited for the purpose,” says Darrell.
Creating product families
While the DFA index provides a data-driven way of measuring new product designs and tracking improvement during redesign, Darrell and Foley thought it would be useful if comparisons could also be made between the designs of different products.
“We have hundreds of products and pretty diverse product groups,” says Foley. “It isn’t really meaningful to compare apples to oranges. It would be better if we could compare one red apple to another.” So they decided to divide the company’s extensive portfolio into a series of product families and then calculate a DFA index family range for each product grouping.
For starters, they separated legacy Motorola products from Symbol’s original product lines. Beyond this broad classification, however, things quickly got more complicated. Consider scanners: A first distinction was whether the device was corded (such as for retail checkout) or wireless (as used for inventory control). Hardwired units are much simpler and have a lot fewer parts than mobile ones, so it was determined that each classification warranted its own product family. Then there was further division into sub-families, depending on whether the product was laser-based or digital. Within groupings, they also included custom products whose only difference might be a minor change in the software, the color of a keypad, or an added logo for a specific customer.
When lumping and splitting in this way, all products within a family or sub-family, while not identical, were closely related by their technology. This ensured that items in a group were more likely to share design strategies and product features. “We got as close as we could to comparing the same kind of apples,” says Foley. The field of products, according to Darrell, included numerous families within both the fire/police radio and scanner/mobile computing portfolios—with each grouping containing between five and ten items.
Once families were created, all products were analyzed using the DFA methodology. This gave the engineering team a DFA index for every product and a range (and average) for each family or sub-family (see Figure 1). They also calculated a DFA index for competitive products. “Benchmarking is always key for us,” says Darrell.
| Scanner Product Family | Number of Products | Minimum DFA Index | Maximum DFA Index | Average DFA Index |
| Scanner Laser-based | 5 | 4.6 | 15.6 | 10.3 |
| Scanner Imager-based | 6 | 7.3 | 15.3 | 10.8 |
| Scanner-on-a-stick Imager-based | 1 | 14.9 | 14.9 | 14.9 |
| Scanner-on-a-stick Laser-based | 2 | 10.9 | 16.4 | 13.7 |
| Scanner w/ radio Imager-based |
1 | 14.7 | 14.7 | 14.7 |
| Scanner w/Radio Laser-based |
2 | 10.6 | 14.4 | 12.5 |
| Mini-Kiosk | 2 | 3.2 | 5 | 4.1 |
| Imager Slot scanners | 1 | 2 | 2 | 2.0 |
| Mobile Computing Product Family | Number of Products | Minimum DFA Index | Maximum DFA Index | Average DFA Index |
| Retail | 2 | 11.2 | 19.5 | 15.35 |
| Light Industrial | 3 | 6.9 | 10.4 | 8.7 |
| Industrial | 8 | 9.5 | 15.3 | 12.80 |
| Retail w/WAN | na | na | na | na |
| Light Industrial w/WAN | 2 | 12.3 | 19.6 | 15.95 |
| Industrial w/WAN | 4 | 13.4 | 18.5 | 14.9 |
| Headsets | 1 | 4.3 | 4.3 | 4.3 |
| Smart Badges | 1 | 12.8 | 12.8 | 12.8 |
| Tablets | 1 | 10.6 | 10.6 | 10.6 |
Figure 1. Using Design for Assembly software, DFA indices were calculated for products in Motorola Solution’s scanner (top) and mobile-computing (bottom) product families. Those values were then used to arrive at ranges and averages for each product family, which serve as goals for future new design and redesign programs.
These metrics helped the global team identify how close designs were to the company’s best-in-class goal. They also gave them a target to shoot at when looking to quantify whether their products were improving. “That’s how we rolled the program out,” says Darrell.
Redeploying DFA globally
The next step was to realign the company’s separate engineering groups in the use of DFA. To do so, Darrell embarked on a world tour of the design centers to retrain teams and get buy-in.
In order to sustain momentum following the tour, Darrell and Foley instituted a weekly global meeting (which is ongoing) with teams from all of the centers participating. Included are experts from design, manufacturing, and operations. “We have the mechanical, process, and quality engineers on the call,” says Foley. “We also have the electrical and software experts and a participant from purchasing as well. There are representatives from every discipline.”
Working with cross-disciplinary groups and using baseline DFA index values has improved the efficiency of the product development process enterprise-wide, says Foley. “In the beginning of a program, for example, we might be worried about cost,” he adds. “We might remember that this family of products had high-cost drivers in labor or maybe some unnecessary parts. Using DFA, we can look back and at the same time think ahead to avoid those sorts of problems. The tool really helps with these design discussions.”
DFA not only focuses engineers on concrete improvements—such as snap-fits, modularization, or fewer connectors—according to Darrell, it also helps the Motorola Solutions team keep up with rapidly developing communications and computer advances, which are integral to many of their units. This includes the design changes needed to adopt technologies such as digital imaging for data capture or Bluetooth. “We need to look at tomorrow’s technology today,” Darrell adds. “Most of our products have revolutionary designs.”
In addition, DFA is instrumental in all three stage-gated phases of the company’s design process—from “concept” to “critical” through the “final” phase, says Darrell. “As we initiate a redesign or new-design project, we’re always trying to improve,” he adds. “Our goal is to be within the index range—or better.”
Measuring for management
“We’re management driven,” Darrell continues. “Every month, I compile the DFA data and present it to senior leadership so they can see how our product development programs are tracking in real time.” If a product has an index lower than the target, it immediately triggers questions at all levels. This built-in early warning system generates targeted scrutiny and redesign activities early in the development cycle.
As part of reporting, Darrell also tabulates the financial benefits the software delivers. “If we come up with a savings of one dollar per unit, for example,” he says, “and we make one hundred thousand units a year, then we saved the company one-hundred-thousand dollars by using DFA upfront.” Quality is number one at Motorola Solutions, but cost reduction is an all-important second.
“We all know that using DFA early in design development is where you get the biggest bang for the buck,” Foley adds. As a result, in all of their design meetings, he and Darrell remind the global team of the hidden costs of adding on parts. It’s a well-documented fact—becoming engineering dogma—that the majority of expenses in a manufacturing organization originate from the designs of its products.
When the final accounting was done, Darrell notes that management’s continued support of the DFA initiative is ensured. Part reduction efforts have successfully cut assembly times on numerous products, and DFA indices almost universally have shown steady improvement—for every product family across the portfolio (see Figure 2). That bottom line allows the company to focus its precious resources on other improvement initiatives.
| Product Family | Type of Product | Model/Name | DFA Index | Product Release |
| MCD | Mobile Computer – Brick/Gun | MC9060 | 9.0 | 2003 |
| MCD | Mobile Computer – Brick/Gun | MC9090 | 13.6 | 2006 |
| MCD | Mobile Computer – Brick/Gun | MC9190 | 14.5 | 2011 |
| Product Family | Type of Product | Model/Name | DFA Index | Product Release |
| Industrial light | Mobile Computer - Brick | MC1000 | 6.9 | 2001 |
| Industrial light | Mobile Computer – Wearable Scanner | Onyx | 8.8 | 2012 |
| Industrial light | Mobile Computer - Brick | MC2100 | 10.4 | 2012 |
Figure 2. In each of these charts, DFA indices were calculated for either redesigns or similar designs of a product as it evolved. The increasing value of the index over time indicates product improvement as defined by decreasing part count using the DFA methodology.
Demystifying DFA
In the complex world of product development, nothing could be more fundamental than product simplification as a means for improving designs. This strategy, when based on the part-reduction methodology of Design for Assembly (DFA) software, leads to reduced assembly labor and cost, improved quality and reliability, and shorter cycle times.
At its most basic, DFA involves the elegant incorporation of multiple parts into a single multifunctional component that shows improved economy and performance. Product engineers are increasingly savvy to the fact that 85 percent of all manufacturing costs are determined in the early stages of design—well before fabrication and assembly processes are locked in.
The DFA index has historically provided a quick, objective measure of assembly efficiency that can serve as a basis for quantitative comparisons of design alternatives, both internally and against competing products. The metric is automatically calculated by taking the assembly time for an “ideal” design (with the theoretical minimum number of parts needed for functionality) and dividing it by the total calculated assembly time of the design with its real-world part count. This result is then expressed as a percent. As the actual assembly time decreases through part reduction efforts, the DFA index increases. Higher indices indicate product improvement. The tool encourages redesign by pointing to specific changes and expresses the penalty associated with poor, or complex, design.
The index calculation, as conceived, was based on “small” products with “ideal” components defined as having the following characteristics: standard symmetry (alpha of 180 degrees and beta of zero degrees); being within “easy reach” of the assembler; secured by a simple snap-fit operation; and without handling or insertion difficulties. These same assumptions are obviously not always the case for larger products and, therefore, use of the assembly index in these instances was not encouraged. Engineering teams, however, can make highly detailed and accurate design comparisons for products of any size using the process time, process cost, and total cost results that have always been an integral part of the software.